Source:
U.S. Bureau of the Census,
2000 Census,
Summary File 1
Please email comments to:
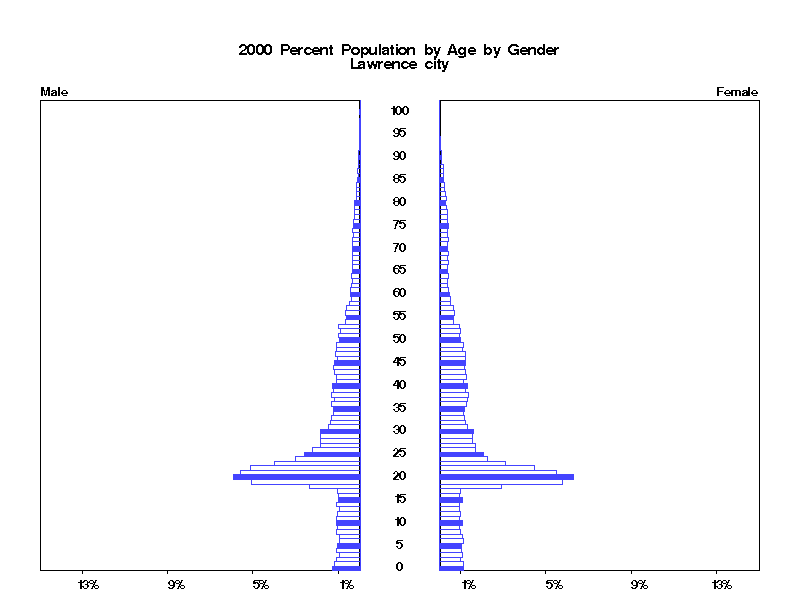
| Lawrence city 2000 Population by Age by Gender | |||||
| AGE | Male | Female | |
||
| Number | Percent | Number | Percent | ||
| under 1 year | 493 | 1.2% | 448 | 1.1% | |
| 1 | 473 | 1.2% | 459 | 1.1% | |
| 2 | 419 | 1.1% | 395 | 1.0% | |
| 3 | 376 | 0.9% | 435 | 1.1% | |
| 4 | 435 | 1.1% | 412 | 1.0% | |
| 5 | 412 | 1.0% | 411 | 1.0% | |
| 6 | 385 | 1.0% | 444 | 1.1% | |
| 7 | 381 | 1.0% | 431 | 1.1% | |
| 8 | 427 | 1.1% | 393 | 1.0% | |
| 9 | 411 | 1.0% | 380 | 0.9% | |
| 10 | 440 | 1.1% | 435 | 1.1% | |
| 11 | 425 | 1.1% | 388 | 1.0% | |
| 12 | 408 | 1.0% | 402 | 1.0% | |
| 13 | 381 | 1.0% | 389 | 1.0% | |
| 14 | 419 | 1.1% | 378 | 0.9% | |
| 15 | 395 | 1.0% | 424 | 1.1% | |
| 16 | 391 | 1.0% | 363 | 0.9% | |
| 17 | 408 | 1.0% | 405 | 1.0% | |
| 18 | 936 | 2.4% | 1177 | 2.9% | |
| 19 | 2020 | 5.1% | 2330 | 5.8% | |
| 20 | 2345 | 5.9% | 2524 | 6.3% | |
| 21 | 2228 | 5.6% | 2212 | 5.5% | |
| 22 | 2043 | 5.1% | 1794 | 4.5% | |
| 23 | 1593 | 4.0% | 1253 | 3.1% | |
| 24 | 1199 | 3.0% | 915 | 2.3% | |
| 25 | 1037 | 2.6% | 837 | 2.1% | |
| 26 | 870 | 2.2% | 677 | 1.7% | |
| 27 | 736 | 1.8% | 665 | 1.7% | |
| 28 | 746 | 1.9% | 625 | 1.6% | |
| 29 | 719 | 1.8% | 629 | 1.6% | |
| 30 | 722 | 1.8% | 640 | 1.6% |
Policy Research Institute,
Source: Please email comments to: |
| 31 | 591 | 1.5% | 535 | 1.3% | |
| 32 | 547 | 1.4% | 494 | 1.2% | |
| 33 | 533 | 1.3% | 482 | 1.2% | |
| 34 | 481 | 1.2% | 443 | 1.1% | |
| 35 | 480 | 1.2% | 481 | 1.2% | |
| 36 | 536 | 1.3% | 502 | 1.2% | |
| 37 | 463 | 1.2% | 517 | 1.3% | |
| 38 | 523 | 1.3% | 546 | 1.4% | |
| 39 | 480 | 1.2% | 498 | 1.2% | |
| 40 | 493 | 1.2% | 519 | 1.3% | |
| 41 | 431 | 1.1% | 462 | 1.1% | |
| 42 | 428 | 1.1% | 501 | 1.2% | |
| 43 | 471 | 1.2% | 492 | 1.2% | |
| 44 | 486 | 1.2% | 482 | 1.2% | |
| 45 | 471 | 1.2% | 495 | 1.2% | |
| 46 | 412 | 1.0% | 490 | 1.2% | |
| 47 | 449 | 1.1% | 484 | 1.2% | |
| 48 | 421 | 1.1% | 430 | 1.1% | |
| 49 | 443 | 1.1% | 465 | 1.2% | |
| 50 | 384 | 1.0% | 402 | 1.0% | |
| 51 | 394 | 1.0% | 374 | 0.9% | |
(Lawrence city continued)
| AGE | Male | Female | |
||
| Number | Percent | Number | Percent | ||
| 52 | 352 | 0.9% | 400 | 1.0% | |
| 53 | 395 | 1.0% | 377 | 0.9% | |
| 54 | 257 | 0.6% | 267 | 0.7% | |
| 55 | 242 | 0.6% | 263 | 0.7% | |
| 56 | 258 | 0.6% | 275 | 0.7% | |
| 57 | 241 | 0.6% | 269 | 0.7% | |
| 58 | 188 | 0.5% | 208 | 0.5% | |
| 59 | 159 | 0.4% | 201 | 0.5% | |
| 60 | 177 | 0.4% | 187 | 0.5% | |
| 61 | 175 | 0.4% | 178 | 0.4% | |
| 62 | 151 | 0.4% | 165 | 0.4% | |
| 63 | 137 | 0.3% | 140 | 0.3% | |
| 64 | 150 | 0.4% | 177 | 0.4% | |
| 65 | 129 | 0.3% | 165 | 0.4% | |
| 66 | 145 | 0.4% | 160 | 0.4% | |
| 67 | 127 | 0.3% | 169 | 0.4% | |
| 68 | 135 | 0.3% | 149 | 0.4% | |
| 69 | 130 | 0.3% | 170 | 0.4% | |
| 70 | 135 | 0.3% | 160 | 0.4% | |
| 71 | 121 | 0.3% | 151 | 0.4% | |
| 72 | 129 | 0.3% | 176 | 0.4% | |
| 73 | 115 | 0.3% | 139 | 0.3% | |
| 74 | 130 | 0.3% | 156 | 0.4% | |
| 75 | 107 | 0.3% | 170 | 0.4% | |
| 76 | 108 | 0.3% | 153 | 0.4% | |
| 77 | 94 | 0.2% | 143 | 0.4% | |
| 78 | 97 | 0.2% | 152 | 0.4% | |
| 79 | 96 | 0.2% | 134 | 0.3% | |
| 80 | 94 | 0.2% | 112 | 0.3% | |
| 81 | 65 | 0.2% | 121 | 0.3% | |
| 82 | 68 | 0.2% | 112 | 0.3% |
Policy Research Institute,
Source: Please email comments to: |
| 83 | 52 | 0.1% | 105 | 0.3% | |
| 84 | 54 | 0.1% | 98 | 0.2% | |
| 85 | 34 | 0.1% | 78 | 0.2% | |
| 86 | 28 | 0.1% | 64 | 0.2% | |
| 87 | 40 | 0.1% | 77 | 0.2% | |
| 88 | 23 | 0.1% | 69 | 0.2% | |
| 89 | 15 | 0.0% | 39 | 0.1% | |
| 90 | 18 | 0.0% | 41 | 0.1% | |
| 91 | 16 | 0.0% | 37 | 0.1% | |
| 92 | 4 | 0.0% | 25 | 0.1% | |
| 93 | 8 | 0.0% | 28 | 0.1% | |
| 94 | 5 | 0.0% | 17 | 0.0% | |
| 95 | 4 | 0.0% | 13 | 0.0% | |
| 96 | 1 | 0.0% | 11 | 0.0% | |
| 97 | 1 | 0.0% | 9 | 0.0% | |
| 98 | 1 | 0.0% | 6 | 0.0% | |
| 99 | 0 | 0.0% | 3 | 0.0% | |
| 100 to 104 | 2 | 0.0% | 9 | 0.0% | |
| 105 to 109 | 0 | 0.0% | 3 | 0.0% | |
| 110 and over | 0 | 0.0% | 0 | 0.0% | |