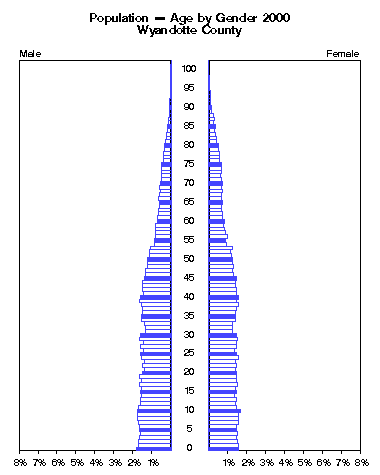
Wyandotte County -- Population by Single Year of Age and Gender 2000
AGEMaleFemaleClick to animate.
 NumberPercentNumberPercent
under 1 year 1388 1.8% 1289 1.6%
  1 1324 1.7% 1280 1.6%
  2 1324 1.7% 1239 1.5%
  3 1269 1.6% 1180 1.5%
  4 1239 1.6% 1227 1.5%
  5 1266 1.6% 1178 1.5%
  6 1283 1.7% 1167 1.4%
  7 1319 1.7% 1245 1.5%
  8 1361 1.8% 1276 1.6%
  9 1348 1.7% 1255 1.6%
10 1358 1.8% 1334 1.7%
11 1298 1.7% 1168 1.4%
12 1235 1.6% 1135 1.4%
13 1243 1.6% 1184 1.5%
14 1205 1.6% 1092 1.4%
15 1245 1.6% 1177 1.5%
16 1172 1.5% 1153 1.4%
17 1287 1.7% 1213 1.5%
18 1196 1.6% 1208 1.5%
19 1259 1.6% 1189 1.5%
20 1155 1.5% 1174 1.5%
Click the figure above to animate by years.
21 1089 1.4% 1162 1.4%
22 1159 1.5% 1172 1.5%
23 1086 1.4% 1159 1.4%

Policy Research Institute
http://www.ku.edu/pri

The University of Kansas

Source:
U.S. Bureau of the Census,
1980 data from Summary Tape File 2B
1990 data from Summary Tape File 2B
2000 data from Summary File 1

Please email comments to: pri@ku.edu
24 1213 1.6% 1248 1.5%
25 1247 1.6% 1202 1.5%
26 1139 1.5% 1089 1.3%
27 1247 1.6% 1202 1.5%
28 1139 1.5% 1187 1.5%
29 1283 1.7% 1213 1.5%
30 1238 1.6% 1191 1.5%
31 1045 1.4% 1028 1.3%
32 1041 1.4% 1006 1.2%
33 1076 1.4% 1030 1.3%
34 1180 1.5% 1156 1.4%
35 1175 1.5% 1131 1.4%
36 1170 1.5% 1150 1.4%
37 1142 1.5% 1198 1.5%
38 1180 1.5% 1248 1.5%
39 1285 1.7% 1203 1.5%
40 1227 1.6% 1275 1.6%
41 1116 1.4% 1196 1.5%
42 1165 1.5% 1204 1.5%

(Wyandotte County continued)

AGEMaleFemale Click to animate.
 NumberPercentNumberPercent
43 1145 1.5% 1144 1.4%
44 1155 1.5% 1119 1.4%
45 1091 1.4% 1189 1.5%
46 1026 1.3% 1052 1.3%
47 1023 1.3% 1027 1.3%
48 953 1.2% 1047 1.3%
49 942 1.2% 987 1.2%
50 965 1.3% 1003 1.2%
51 867 1.1% 954 1.2%
52 856 1.1% 950 1.2%
53 829 1.1% 989 1.2%
54 670 0.9% 732 0.9%
55 656 0.9% 725 0.9%
56 639 0.8% 782 1.0%
57 643 0.8% 708 0.9%
58 645 0.8% 663 0.8%
59 635 0.8% 633 0.8%
60 545 0.7% 652 0.8%
61 555 0.7% 590 0.7%
62 505 0.7% 593 0.7%
63 496 0.6% 555 0.7%
Click the figure above to animate by years.
64 453 0.6% 545 0.7%
65 460 0.6% 606 0.7%

Policy Research Institute
http://www.ku.edu/pri

The University of Kansas

Source:
U.S. Bureau of the Census,
1980 data from Summary Tape File 2B
1990 data from Summary Tape File 2B
2000 data from Summary File 1

Please email comments to: pri@ku.edu
66 483 0.6% 519 0.6%
67 453 0.6% 543 0.7%
68 443 0.6% 576 0.7%
69 449 0.6% 524 0.6%
70 447 0.6% 580 0.7%
71 373 0.5% 533 0.7%
72 385 0.5% 516 0.6%
73 388 0.5% 558 0.7%
74 376 0.5% 524 0.6%
75 357 0.5% 554 0.7%
76 317 0.4% 454 0.6%
77 318 0.4% 479 0.6%
78 289 0.4% 484 0.6%
79 252 0.3% 430 0.5%
80 248 0.3% 399 0.5%
81 214 0.3% 352 0.4%
82 191 0.2% 353 0.4%
83 165 0.2% 303 0.4%
84 144 0.2% 255 0.3%
85 127 0.2% 285 0.4%
86 101 0.1% 223 0.3%
87 83 0.1% 237 0.3%
88 60 0.1% 178 0.2%
89 47 0.1% 141 0.2%
90 48 0.1% 109 0.1%
91 39 0.1% 86 0.1%
92 41 0.1% 87 0.1%
93 10 0.0% 82 0.1%
94 14 0.0% 60 0.1%
95 13 0.0% 39 0.0%
96 4 0.0% 25 0.0%
97 4 0.0% 22 0.0%
98 5 0.0% 17 0.0%
99 4 0.0% 9 0.0%
100 to 104 8 0.0% 15 0.0%
105 to 109 1 0.0% 1 0.0%
110 and over 0 0.0% 1 0.0%