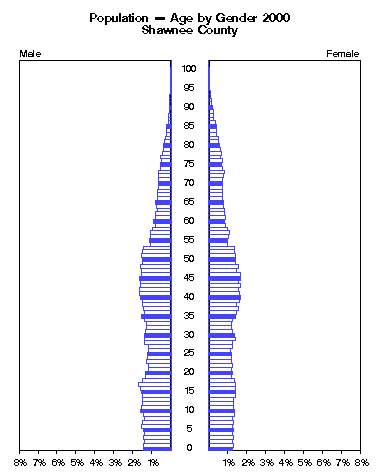
Shawnee County -- Population by Single Year of Age and Gender 2000
AGEMaleFemaleClick to animate.
 NumberPercentNumberPercent
under 1 year 1179 1.4% 1096 1.3%
  1 1199 1.5% 1155 1.3%
  2 1154 1.4% 1107 1.3%
  3 1185 1.4% 1133 1.3%
  4 1164 1.4% 1120 1.3%
  5 1182 1.4% 1153 1.3%
  6 1257 1.5% 1103 1.3%
  7 1250 1.5% 1169 1.3%
  8 1149 1.4% 1107 1.3%
  9 1188 1.4% 1184 1.4%
10 1304 1.6% 1175 1.3%
11 1259 1.5% 1162 1.3%
12 1218 1.5% 1139 1.3%
13 1250 1.5% 1144 1.3%
14 1227 1.5% 1219 1.4%
15 1258 1.5% 1214 1.4%
16 1314 1.6% 1214 1.4%
17 1392 1.7% 1250 1.4%
18 1226 1.5% 1176 1.3%
19 1092 1.3% 1069 1.2%
20 1094 1.3% 1089 1.2%
Click the figure above to animate by years.
21 981 1.2% 1038 1.2%
22 985 1.2% 1082 1.2%
23 1041 1.3% 1050 1.2%

Policy Research Institute
http://www.ku.edu/pri

The University of Kansas

Source:
U.S. Bureau of the Census,
1980 data from Summary Tape File 2B
1990 data from Summary Tape File 2B
2000 data from Summary File 1

Please email comments to: pri@ku.edu
24 1021 1.2% 1066 1.2%
25 1029 1.3% 1040 1.2%
26 968 1.2% 1019 1.2%
27 986 1.2% 1100 1.3%
28 1119 1.4% 1105 1.3%
29 1129 1.4% 1213 1.4%
30 1162 1.4% 1197 1.4%
31 1094 1.3% 1117 1.3%
32 1048 1.3% 1058 1.2%
33 1058 1.3% 1069 1.2%
34 1152 1.4% 1109 1.3%
35 1269 1.5% 1249 1.4%
36 1140 1.4% 1314 1.5%
37 1192 1.4% 1377 1.6%
38 1246 1.5% 1307 1.5%
39 1221 1.5% 1411 1.6%
40 1328 1.6% 1459 1.7%
41 1339 1.6% 1428 1.6%
42 1338 1.6% 1395 1.6%

(Shawnee County continued)

AGEMaleFemale Click to animate.
 NumberPercentNumberPercent
43 1316 1.6% 1455 1.7%
44 1325 1.6% 1357 1.5%
45 1369 1.7% 1464 1.7%
46 1280 1.6% 1468 1.7%
47 1296 1.6% 1300 1.5%
48 1302 1.6% 1360 1.6%
49 1230 1.5% 1260 1.4%
50 1230 1.5% 1247 1.4%
51 1259 1.5% 1248 1.4%
52 1235 1.5% 1178 1.3%
53 1168 1.4% 1201 1.4%
54 884 1.1% 879 1.0%
55 920 1.1% 870 1.0%
56 877 1.1% 919 1.0%
57 889 1.1% 939 1.1%
58 797 1.0% 871 1.0%
59 671 0.8% 773 0.9%
60 729 0.9% 730 0.8%
61 687 0.8% 781 0.9%
62 647 0.8% 734 0.8%
63 605 0.7% 706 0.8%
Click the figure above to animate by years.
64 609 0.7% 697 0.8%
65 649 0.8% 669 0.8%

Policy Research Institute
http://www.ku.edu/pri

The University of Kansas

Source:
U.S. Bureau of the Census,
1980 data from Summary Tape File 2B
1990 data from Summary Tape File 2B
2000 data from Summary File 1

Please email comments to: pri@ku.edu
66 581 0.7% 636 0.7%
67 597 0.7% 640 0.7%
68 573 0.7% 631 0.7%
69 543 0.7% 666 0.8%
70 515 0.6% 625 0.7%
71 527 0.6% 651 0.7%
72 529 0.6% 690 0.8%
73 528 0.6% 703 0.8%
74 445 0.5% 656 0.7%
75 470 0.6% 609 0.7%
76 427 0.5% 623 0.7%
77 429 0.5% 560 0.6%
78 368 0.4% 608 0.7%
79 345 0.4% 553 0.6%
80 311 0.4% 506 0.6%
81 265 0.3% 442 0.5%
82 239 0.3% 421 0.5%
83 203 0.2% 356 0.4%
84 168 0.2% 343 0.4%
85 171 0.2% 347 0.4%
86 126 0.2% 300 0.3%
87 103 0.1% 236 0.3%
88 86 0.1% 229 0.3%
89 72 0.1% 209 0.2%
90 68 0.1% 186 0.2%
91 50 0.1% 155 0.2%
92 38 0.0% 149 0.2%
93 39 0.0% 93 0.1%
94 22 0.0% 79 0.1%
95 13 0.0% 50 0.1%
96 11 0.0% 50 0.1%
97 6 0.0% 49 0.1%
98 1 0.0% 25 0.0%
99 1 0.0% 26 0.0%
100 to 104 8 0.0% 40 0.0%
105 to 109 0 0.0% 3 0.0%
110 and over 0 0.0% 0 0.0%