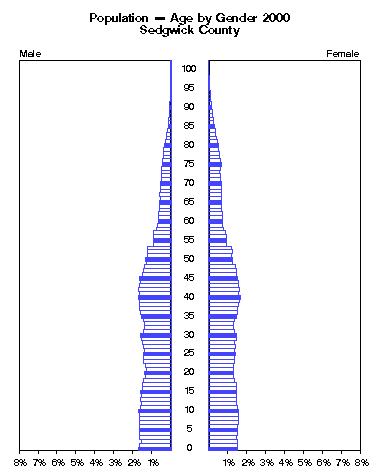
Sedgwick County -- Population by Single Year of Age and Gender 2000
AGEMaleFemaleClick to animate.
 NumberPercentNumberPercent
under 1 year 3772 1.7% 3489 1.5%
  1 3698 1.7% 3480 1.5%
  2 3528 1.6% 3444 1.5%
  3 3679 1.6% 3412 1.5%
  4 3712 1.7% 3483 1.5%
  5 3696 1.7% 3459 1.5%
  6 3735 1.7% 3452 1.5%
  7 3726 1.7% 3603 1.6%
  8 3754 1.7% 3659 1.6%
  9 3662 1.6% 3579 1.6%
10 3814 1.7% 3575 1.6%
11 3559 1.6% 3472 1.5%
12 3499 1.6% 3303 1.4%
13 3582 1.6% 3377 1.5%
14 3470 1.6% 3392 1.5%
15 3544 1.6% 3421 1.5%
16 3385 1.5% 3349 1.5%
17 3399 1.5% 3372 1.5%
18 3215 1.4% 3112 1.4%
19 3002 1.3% 2973 1.3%
20 3102 1.4% 3040 1.3%
Click the figure above to animate by years.
21 2939 1.3% 3001 1.3%
22 2961 1.3% 3030 1.3%
23 3189 1.4% 3127 1.4%

Policy Research Institute
http://www.ku.edu/pri

The University of Kansas

Source:
U.S. Bureau of the Census,
1980 data from Summary Tape File 2B
1990 data from Summary Tape File 2B
2000 data from Summary File 1

Please email comments to: pri@ku.edu
24 3298 1.5% 3104 1.4%
25 3300 1.5% 3229 1.4%
26 3161 1.4% 3092 1.4%
27 3245 1.4% 3203 1.4%
28 3334 1.5% 3149 1.4%
29 3445 1.5% 3365 1.5%
30 3545 1.6% 3324 1.5%
31 3291 1.5% 3080 1.3%
32 3150 1.4% 2969 1.3%
33 3113 1.4% 3060 1.3%
34 3271 1.5% 3133 1.4%
35 3479 1.6% 3388 1.5%
36 3544 1.6% 3503 1.5%
37 3726 1.7% 3438 1.5%
38 3722 1.7% 3540 1.5%
39 3677 1.6% 3689 1.6%
40 3881 1.7% 3890 1.7%
41 3706 1.7% 3663 1.6%
42 3815 1.7% 3669 1.6%

(Sedgwick County continued)

AGEMaleFemale Click to animate.
 NumberPercentNumberPercent
43 3705 1.7% 3649 1.6%
44 3585 1.6% 3599 1.6%
45 3676 1.6% 3458 1.5%
46 3338 1.5% 3397 1.5%
47 3301 1.5% 3309 1.4%
48 3139 1.4% 3170 1.4%
49 2937 1.3% 2873 1.3%
50 2991 1.3% 2847 1.2%
51 2769 1.2% 2777 1.2%
52 2816 1.3% 2835 1.2%
53 2690 1.2% 2717 1.2%
54 2054 0.9% 2068 0.9%
55 2021 0.9% 2167 0.9%
56 2068 0.9% 2187 1.0%
57 2043 0.9% 1984 0.9%
58 1744 0.8% 1821 0.8%
59 1542 0.7% 1694 0.7%
60 1473 0.7% 1630 0.7%
61 1469 0.7% 1609 0.7%
62 1417 0.6% 1612 0.7%
63 1355 0.6% 1521 0.7%
Click the figure above to animate by years.
64 1335 0.6% 1486 0.6%
65 1384 0.6% 1591 0.7%

Policy Research Institute
http://www.ku.edu/pri

The University of Kansas

Source:
U.S. Bureau of the Census,
1980 data from Summary Tape File 2B
1990 data from Summary Tape File 2B
2000 data from Summary File 1

Please email comments to: pri@ku.edu
66 1203 0.5% 1502 0.7%
67 1338 0.6% 1547 0.7%
68 1255 0.6% 1514 0.7%
69 1242 0.6% 1549 0.7%
70 1258 0.6% 1522 0.7%
71 1097 0.5% 1400 0.6%
72 1154 0.5% 1454 0.6%
73 1074 0.5% 1366 0.6%
74 1060 0.5% 1413 0.6%
75 1028 0.5% 1470 0.6%
76 974 0.4% 1433 0.6%
77 910 0.4% 1335 0.6%
78 899 0.4% 1296 0.6%
79 832 0.4% 1174 0.5%
80 702 0.3% 1102 0.5%
81 603 0.3% 1014 0.4%
82 535 0.2% 932 0.4%
83 448 0.2% 810 0.4%
84 392 0.2% 788 0.3%
85 328 0.1% 648 0.3%
86 274 0.1% 611 0.3%
87 273 0.1% 531 0.2%
88 181 0.1% 451 0.2%
89 144 0.1% 435 0.2%
90 127 0.1% 343 0.1%
91 93 0.0% 284 0.1%
92 78 0.0% 252 0.1%
93 56 0.0% 172 0.1%
94 35 0.0% 139 0.1%
95 26 0.0% 110 0.0%
96 21 0.0% 97 0.0%
97 13 0.0% 75 0.0%
98 14 0.0% 48 0.0%
99 8 0.0% 42 0.0%
100 to 104 16 0.0% 44 0.0%
105 to 109 1 0.0% 3 0.0%
110 and over 1 0.0% 0 0.0%