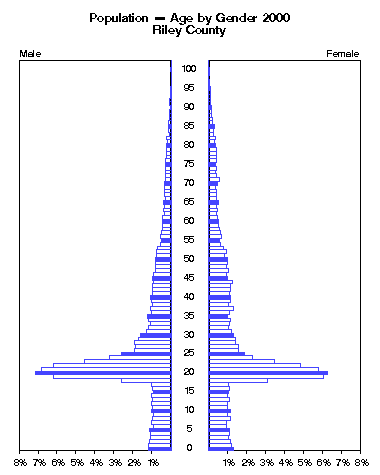
Riley County -- Population by Single Year of Age and Gender 2000
AGEMaleFemaleClick to animate.
 NumberPercentNumberPercent
under 1 year 398 1.2% 381 1.3%
  1 397 1.2% 351 1.2%
  2 370 1.1% 344 1.2%
  3 364 1.1% 302 1.0%
  4 361 1.1% 318 1.1%
  5 374 1.1% 325 1.1%
  6 310 0.9% 269 0.9%
  7 340 1.0% 280 1.0%
  8 327 1.0% 340 1.2%
  9 314 0.9% 287 1.0%
10 343 1.0% 329 1.1%
11 322 1.0% 286 1.0%
12 337 1.0% 296 1.0%
13 324 1.0% 315 1.1%
14 345 1.0% 290 1.0%
15 311 0.9% 309 1.1%
16 322 1.0% 313 1.1%
17 337 1.0% 309 1.1%
18 876 2.6% 904 3.1%
19 2074 6.2% 1777 6.1%
20 2391 7.1% 1843 6.3%
Click the figure above to animate by years.
21 2295 6.8% 1699 5.8%
22 2073 6.2% 1424 4.9%
23 1534 4.6% 1012 3.5%

Policy Research Institute
http://www.ku.edu/pri

The University of Kansas

Source:
U.S. Bureau of the Census,
1980 data from Summary Tape File 2B
1990 data from Summary Tape File 2B
2000 data from Summary File 1

Please email comments to: pri@ku.edu
24 1081 3.2% 682 2.3%
25 877 2.6% 558 1.9%
26 638 1.9% 463 1.6%
27 635 1.9% 469 1.6%
28 650 1.9% 415 1.4%
29 577 1.7% 421 1.4%
30 538 1.6% 388 1.3%
31 436 1.3% 352 1.2%
32 389 1.2% 306 1.0%
33 349 1.0% 313 1.1%
34 398 1.2% 332 1.1%
35 405 1.2% 298 1.0%
36 348 1.0% 317 1.1%
37 358 1.1% 377 1.3%
38 324 1.0% 307 1.0%
39 347 1.0% 330 1.1%
40 357 1.1% 344 1.2%
41 326 1.0% 326 1.1%
42 319 1.0% 333 1.1%

(Riley County continued)

AGEMaleFemale Click to animate.
 NumberPercentNumberPercent
43 331 1.0% 331 1.1%
44 315 0.9% 361 1.2%
45 320 1.0% 298 1.0%
46 306 0.9% 277 0.9%
47 281 0.8% 308 1.1%
48 277 0.8% 273 0.9%
49 276 0.8% 291 1.0%
50 272 0.8% 299 1.0%
51 259 0.8% 245 0.8%
52 249 0.7% 278 0.9%
53 238 0.7% 234 0.8%
54 180 0.5% 180 0.6%
55 173 0.5% 168 0.6%
56 193 0.6% 193 0.7%
57 161 0.5% 179 0.6%
58 152 0.5% 170 0.6%
59 141 0.4% 155 0.5%
60 154 0.5% 148 0.5%
61 143 0.4% 135 0.5%
62 114 0.3% 127 0.4%
63 129 0.4% 134 0.5%
Click the figure above to animate by years.
64 116 0.3% 125 0.4%
65 124 0.4% 141 0.5%

Policy Research Institute
http://www.ku.edu/pri

The University of Kansas

Source:
U.S. Bureau of the Census,
1980 data from Summary Tape File 2B
1990 data from Summary Tape File 2B
2000 data from Summary File 1

Please email comments to: pri@ku.edu
66 99 0.3% 112 0.4%
67 115 0.3% 126 0.4%
68 101 0.3% 114 0.4%
69 116 0.3% 109 0.4%
70 105 0.3% 130 0.4%
71 99 0.3% 162 0.6%
72 92 0.3% 124 0.4%
73 93 0.3% 110 0.4%
74 93 0.3% 123 0.4%
75 91 0.3% 105 0.4%
76 97 0.3% 124 0.4%
77 82 0.2% 114 0.4%
78 85 0.3% 113 0.4%
79 78 0.2% 114 0.4%
80 72 0.2% 99 0.3%
81 56 0.2% 88 0.3%
82 73 0.2% 99 0.3%
83 30 0.1% 76 0.3%
84 41 0.1% 74 0.3%
85 39 0.1% 88 0.3%
86 38 0.1% 59 0.2%
87 30 0.1% 60 0.2%
88 24 0.1% 47 0.2%
89 17 0.1% 42 0.1%
90 12 0.0% 43 0.1%
91 15 0.0% 34 0.1%
92 14 0.0% 28 0.1%
93 12 0.0% 23 0.1%
94 6 0.0% 20 0.1%
95 3 0.0% 29 0.1%
96 0 0.0% 11 0.0%
97 0 0.0% 9 0.0%
98 0 0.0% 5 0.0%
99 0 0.0% 11 0.0%
100 to 104 1 0.0% 8 0.0%
105 to 109 0 0.0% 2 0.0%
110 and over 0 0.0% 0 0.0%