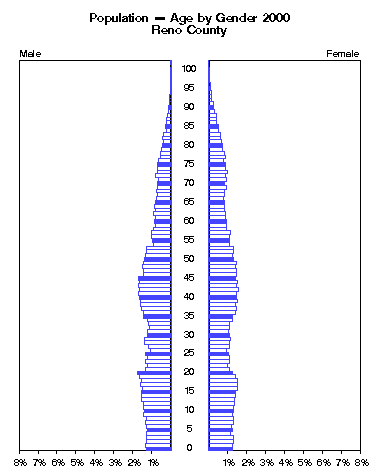
Reno County -- Population by Single Year of Age and Gender 2000
AGEMaleFemaleClick to animate.
 NumberPercentNumberPercent
under 1 year 428 1.3% 394 1.2%
  1 440 1.4% 402 1.2%
  2 412 1.3% 427 1.3%
  3 417 1.3% 423 1.3%
  4 428 1.3% 367 1.1%
  5 409 1.3% 412 1.3%
  6 419 1.3% 391 1.2%
  7 434 1.3% 417 1.3%
  8 422 1.3% 415 1.3%
  9 463 1.4% 396 1.2%
10 455 1.4% 425 1.3%
11 467 1.4% 425 1.3%
12 471 1.4% 438 1.4%
13 510 1.6% 442 1.4%
14 497 1.5% 455 1.4%
15 504 1.5% 452 1.4%
16 494 1.5% 494 1.5%
17 518 1.6% 489 1.5%
18 508 1.6% 493 1.5%
19 534 1.6% 448 1.4%
20 574 1.8% 401 1.2%
Click the figure above to animate by years.
21 438 1.3% 351 1.1%
22 396 1.2% 324 1.0%
23 436 1.3% 355 1.1%

Policy Research Institute
http://www.ku.edu/pri

The University of Kansas

Source:
U.S. Bureau of the Census,
1980 data from Summary Tape File 2B
1990 data from Summary Tape File 2B
2000 data from Summary File 1

Please email comments to: pri@ku.edu
24 409 1.3% 360 1.1%
25 430 1.3% 334 1.0%
26 357 1.1% 296 0.9%
27 388 1.2% 343 1.1%
28 449 1.4% 347 1.1%
29 452 1.4% 364 1.1%
30 401 1.2% 359 1.1%
31 404 1.2% 336 1.0%
32 360 1.1% 351 1.1%
33 386 1.2% 349 1.1%
34 401 1.2% 399 1.2%
35 479 1.5% 408 1.3%
36 473 1.5% 458 1.4%
37 510 1.6% 473 1.5%
38 520 1.6% 455 1.4%
39 517 1.6% 488 1.5%
40 529 1.6% 481 1.5%
41 552 1.7% 471 1.5%
42 542 1.7% 509 1.6%

(Reno County continued)

AGEMaleFemale Click to animate.
 NumberPercentNumberPercent
43 560 1.7% 481 1.5%
44 537 1.7% 496 1.5%
45 554 1.7% 462 1.4%
46 479 1.5% 477 1.5%
47 473 1.5% 481 1.5%
48 482 1.5% 458 1.4%
49 477 1.5% 470 1.5%
50 457 1.4% 413 1.3%
51 441 1.4% 404 1.3%
52 426 1.3% 413 1.3%
53 410 1.3% 429 1.3%
54 302 0.9% 356 1.1%
55 324 1.0% 354 1.1%
56 333 1.0% 350 1.1%
57 326 1.0% 365 1.1%
58 296 0.9% 307 1.0%
59 262 0.8% 294 0.9%
60 282 0.9% 306 0.9%
61 257 0.8% 283 0.9%
62 288 0.9% 285 0.9%
63 268 0.8% 263 0.8%
Click the figure above to animate by years.
64 274 0.8% 267 0.8%
65 255 0.8% 263 0.8%

Policy Research Institute
http://www.ku.edu/pri

The University of Kansas

Source:
U.S. Bureau of the Census,
1980 data from Summary Tape File 2B
1990 data from Summary Tape File 2B
2000 data from Summary File 1

Please email comments to: pri@ku.edu
66 253 0.8% 247 0.8%
67 229 0.7% 275 0.9%
68 241 0.7% 274 0.8%
69 227 0.7% 292 0.9%
70 230 0.7% 274 0.8%
71 202 0.6% 296 0.9%
72 256 0.8% 290 0.9%
73 224 0.7% 310 1.0%
74 228 0.7% 284 0.9%
75 228 0.7% 278 0.9%
76 204 0.6% 247 0.8%
77 187 0.6% 284 0.9%
78 180 0.6% 263 0.8%
79 164 0.5% 235 0.7%
80 147 0.5% 235 0.7%
81 127 0.4% 213 0.7%
82 139 0.4% 199 0.6%
83 123 0.4% 194 0.6%
84 81 0.2% 173 0.5%
85 86 0.3% 161 0.5%
86 78 0.2% 131 0.4%
87 69 0.2% 141 0.4%
88 58 0.2% 134 0.4%
89 47 0.1% 97 0.3%
90 41 0.1% 84 0.3%
91 19 0.1% 81 0.3%
92 20 0.1% 53 0.2%
93 15 0.0% 56 0.2%
94 12 0.0% 48 0.1%
95 6 0.0% 28 0.1%
96 3 0.0% 27 0.1%
97 4 0.0% 19 0.1%
98 1 0.0% 13 0.0%
99 4 0.0% 8 0.0%
100 to 104 4 0.0% 15 0.0%
105 to 109 0 0.0% 2 0.0%
110 and over 1 0.0% 1 0.0%