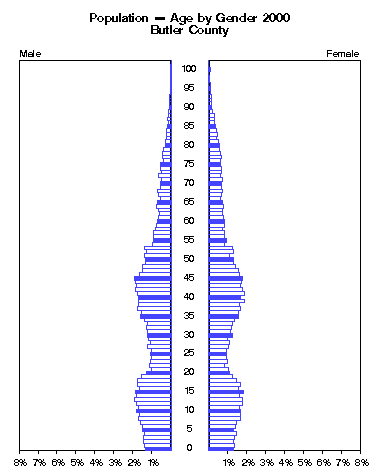
Butler County -- Population by Single Year of Age and Gender 2000
AGEMaleFemaleClick to animate.
 NumberPercentNumberPercent
under 1 year 405 1.4% 382 1.3%
  1 424 1.4% 398 1.3%
  2 439 1.5% 386 1.3%
  3 440 1.5% 404 1.4%
  4 416 1.4% 437 1.5%
  5 446 1.5% 392 1.3%
  6 446 1.5% 425 1.4%
  7 480 1.6% 444 1.5%
  8 506 1.7% 487 1.6%
  9 501 1.7% 491 1.7%
10 535 1.8% 488 1.6%
11 518 1.7% 477 1.6%
12 542 1.8% 522 1.8%
13 577 1.9% 527 1.8%
14 535 1.8% 482 1.6%
15 552 1.8% 544 1.8%
16 494 1.7% 463 1.6%
17 530 1.8% 502 1.7%
18 523 1.8% 443 1.5%
19 465 1.6% 371 1.3%
20 390 1.3% 330 1.1%
Click the figure above to animate by years.
21 309 1.0% 309 1.0%
22 336 1.1% 244 0.8%
23 316 1.1% 285 1.0%

Policy Research Institute
http://www.ku.edu/pri

The University of Kansas

Source:
U.S. Bureau of the Census,
1980 data from Summary Tape File 2B
1990 data from Summary Tape File 2B
2000 data from Summary File 1

Please email comments to: pri@ku.edu
24 306 1.0% 281 0.9%
25 328 1.1% 279 0.9%
26 310 1.0% 280 0.9%
27 370 1.2% 305 1.0%
28 312 1.0% 321 1.1%
29 349 1.2% 296 1.0%
30 370 1.2% 378 1.3%
31 376 1.3% 345 1.2%
32 385 1.3% 360 1.2%
33 374 1.3% 362 1.2%
34 424 1.4% 400 1.4%
35 476 1.6% 466 1.6%
36 467 1.6% 457 1.5%
37 530 1.8% 493 1.7%
38 516 1.7% 481 1.6%
39 514 1.7% 564 1.9%
40 515 1.7% 489 1.7%
41 524 1.8% 557 1.9%
42 551 1.8% 526 1.8%

(Butler County continued)

AGEMaleFemale Click to animate.
 NumberPercentNumberPercent
43 546 1.8% 486 1.6%
44 553 1.9% 513 1.7%
45 568 1.9% 532 1.8%
46 494 1.7% 484 1.6%
47 443 1.5% 457 1.5%
48 452 1.5% 410 1.4%
49 395 1.3% 390 1.3%
50 395 1.3% 383 1.3%
51 424 1.4% 320 1.1%
52 382 1.3% 386 1.3%
53 418 1.4% 373 1.3%
54 298 1.0% 254 0.9%
55 273 0.9% 272 0.9%
56 275 0.9% 252 0.9%
57 269 0.9% 253 0.9%
58 243 0.8% 220 0.7%
59 223 0.7% 237 0.8%
60 215 0.7% 244 0.8%
61 191 0.6% 228 0.8%
62 180 0.6% 209 0.7%
63 195 0.7% 211 0.7%
Click the figure above to animate by years.
64 228 0.8% 230 0.8%
65 204 0.7% 215 0.7%

Policy Research Institute
http://www.ku.edu/pri

The University of Kansas

Source:
U.S. Bureau of the Census,
1980 data from Summary Tape File 2B
1990 data from Summary Tape File 2B
2000 data from Summary File 1

Please email comments to: pri@ku.edu
66 160 0.5% 187 0.6%
67 189 0.6% 193 0.7%
68 205 0.7% 213 0.7%
69 166 0.6% 192 0.6%
70 173 0.6% 193 0.7%
71 149 0.5% 210 0.7%
72 203 0.7% 189 0.6%
73 147 0.5% 192 0.6%
74 173 0.6% 202 0.7%
75 162 0.5% 188 0.6%
76 121 0.4% 186 0.6%
77 130 0.4% 192 0.6%
78 128 0.4% 179 0.6%
79 109 0.4% 176 0.6%
80 88 0.3% 176 0.6%
81 84 0.3% 158 0.5%
82 67 0.2% 120 0.4%
83 69 0.2% 142 0.5%
84 60 0.2% 123 0.4%
85 51 0.2% 107 0.4%
86 39 0.1% 92 0.3%
87 49 0.2% 94 0.3%
88 40 0.1% 91 0.3%
89 31 0.1% 60 0.2%
90 24 0.1% 53 0.2%
91 14 0.0% 53 0.2%
92 15 0.1% 53 0.2%
93 13 0.0% 36 0.1%
94 11 0.0% 30 0.1%
95 6 0.0% 24 0.1%
96 2 0.0% 24 0.1%
97 4 0.0% 13 0.0%
98 2 0.0% 7 0.0%
99 1 0.0% 5 0.0%
100 to 104 4 0.0% 19 0.1%
105 to 109 1 0.0% 2 0.0%
110 and over 0 0.0% 0 0.0%