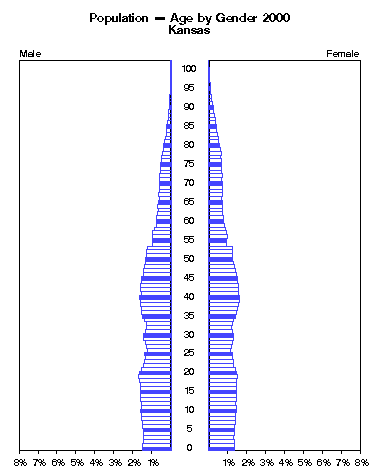
Kansas -- Population by Single Year of Age and Gender 2000
AGEMaleFemaleClick to animate.
 NumberPercentNumberPercent
under 1 year 19751 1.5% 18226 1.3%
  1 19696 1.5% 18539 1.4%
  2 18985 1.4% 18259 1.3%
  3 19051 1.4% 17998 1.3%
  4 19529 1.5% 18674 1.4%
  5 19598 1.5% 18556 1.4%
  6 19780 1.5% 18471 1.4%
  7 20066 1.5% 19055 1.4%
  8 20369 1.5% 19503 1.4%
  9 20620 1.6% 19556 1.4%
10 21311 1.6% 20100 1.5%
11 20711 1.6% 19587 1.4%
12 20576 1.5% 19548 1.4%
13 21011 1.6% 19777 1.5%
14 21372 1.6% 20025 1.5%
15 21389 1.6% 20240 1.5%
16 21044 1.6% 20261 1.5%
17 21421 1.6% 20338 1.5%
18 21638 1.6% 20362 1.5%
19 22548 1.7% 20877 1.5%
20 22109 1.7% 20378 1.5%
Click the figure above to animate by years.
21 20310 1.5% 18775 1.4%
22 19472 1.5% 18066 1.3%
23 18827 1.4% 17487 1.3%

Policy Research Institute
http://www.ku.edu/pri

The University of Kansas

Source:
U.S. Bureau of the Census,
1980 data from Summary Tape File 2B
1990 data from Summary Tape File 2B
2000 data from Summary File 1

Please email comments to: pri@ku.edu
24 18049 1.4% 16694 1.2%
25 18166 1.4% 16602 1.2%
26 16680 1.3% 15768 1.2%
27 17347 1.3% 16475 1.2%
28 17967 1.4% 16876 1.2%
29 18874 1.4% 18220 1.3%
30 19190 1.4% 17961 1.3%
31 17636 1.3% 16919 1.2%
32 17048 1.3% 16402 1.2%
33 17259 1.3% 17061 1.3%
34 18477 1.4% 17925 1.3%
35 19973 1.5% 19495 1.4%
36 20530 1.5% 20262 1.5%
37 20736 1.6% 20926 1.5%
38 21291 1.6% 21137 1.6%
39 21404 1.6% 21795 1.6%
40 21718 1.6% 21968 1.6%
41 20905 1.6% 21104 1.6%
42 21488 1.6% 21593 1.6%

(Kansas continued)

AGEMaleFemale Click to animate.
 NumberPercentNumberPercent
43 21412 1.6% 21059 1.5%
44 20871 1.6% 20684 1.5%
45 20980 1.6% 20710 1.5%
46 19653 1.5% 19916 1.5%
47 19356 1.5% 19295 1.4%
48 18705 1.4% 18645 1.4%
49 17850 1.3% 17569 1.3%
50 17754 1.3% 17329 1.3%
51 16930 1.3% 16601 1.2%
52 17188 1.3% 17086 1.3%
53 16646 1.3% 16756 1.2%
54 12603 0.9% 12575 0.9%
55 12606 0.9% 13017 1.0%
56 12689 1.0% 13258 1.0%
57 12693 1.0% 12923 1.0%
58 11181 0.8% 11702 0.9%
59 10354 0.8% 11222 0.8%
60 10145 0.8% 10751 0.8%
61 9883 0.7% 10473 0.8%
62 9465 0.7% 10297 0.8%
63 9028 0.7% 9750 0.7%
Click the figure above to animate by years.
64 9045 0.7% 9771 0.7%
65 8928 0.7% 9862 0.7%

Policy Research Institute
http://www.ku.edu/pri

The University of Kansas

Source:
U.S. Bureau of the Census,
1980 data from Summary Tape File 2B
1990 data from Summary Tape File 2B
2000 data from Summary File 1

Please email comments to: pri@ku.edu
66 8120 0.6% 9452 0.7%
67 8298 0.6% 9644 0.7%
68 8165 0.6% 9655 0.7%
69 8130 0.6% 9831 0.7%
70 7967 0.6% 9807 0.7%
71 7752 0.6% 9491 0.7%
72 7870 0.6% 9546 0.7%
73 7475 0.6% 9373 0.7%
74 7245 0.5% 9305 0.7%
75 7118 0.5% 9107 0.7%
76 6700 0.5% 8982 0.7%
77 6154 0.5% 8555 0.6%
78 5906 0.4% 8809 0.6%
79 5479 0.4% 8315 0.6%
80 4859 0.4% 7723 0.6%
81 4325 0.3% 7275 0.5%
82 3958 0.3% 6633 0.5%
83 3420 0.3% 6273 0.5%
84 3034 0.2% 5918 0.4%
85 2673 0.2% 5527 0.4%
86 2312 0.2% 4881 0.4%
87 2125 0.2% 4556 0.3%
88 1648 0.1% 3981 0.3%
89 1341 0.1% 3558 0.3%
90 1110 0.1% 2996 0.2%
91 907 0.1% 2551 0.2%
92 718 0.1% 2188 0.2%
93 544 0.0% 1753 0.1%
94 380 0.0% 1347 0.1%
95 256 0.0% 1044 0.1%
96 194 0.0% 848 0.1%
97 117 0.0% 624 0.0%
98 81 0.0% 405 0.0%
99 79 0.0% 316 0.0%
100 to 104 116 0.0% 542 0.0%
105 to 109 8 0.0% 38 0.0%
110 and over 3 0.0% 3 0.0%