Source:
U.S. Bureau of the Census,
1990 Census of Population and Housing,
Summary Tape File 2
Please email comments to:
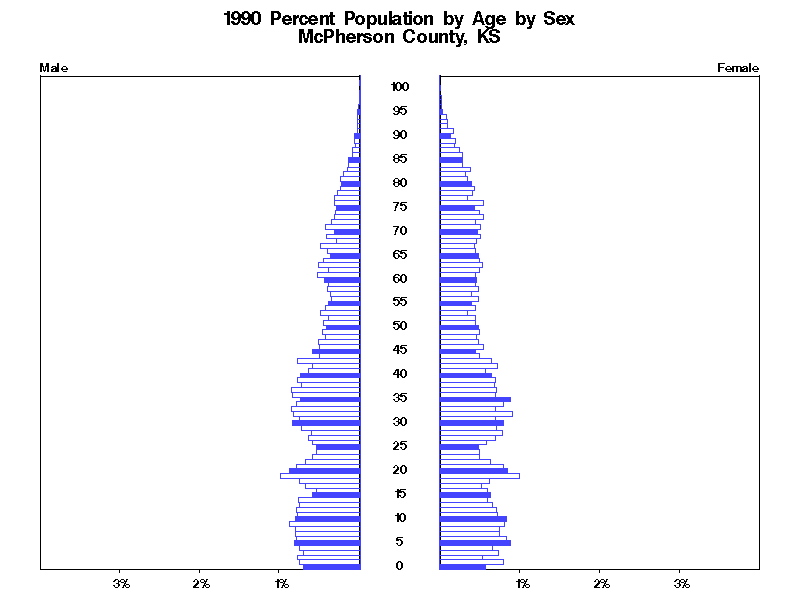
| McPherson County, KS 1990 Population by Age by Sex | |||||
| AGE | Male | Female | |
||
| Number | Percent | Number | Percent | ||
| under 1 year | 193 | 0.7% | 156 | 0.6% | |
| 1 | 205 | 0.8% | 217 | 0.8% | |
| 2 | 211 | 0.8% | 146 | 0.5% | |
| 3 | 191 | 0.7% | 199 | 0.7% | |
| 4 | 205 | 0.8% | 180 | 0.7% | |
| 5 | 222 | 0.8% | 240 | 0.9% | |
| 6 | 214 | 0.8% | 226 | 0.8% | |
| 7 | 220 | 0.8% | 203 | 0.7% | |
| 8 | 220 | 0.8% | 202 | 0.7% | |
| 9 | 238 | 0.9% | 221 | 0.8% | |
| 10 | 219 | 0.8% | 226 | 0.8% | |
| 11 | 211 | 0.8% | 197 | 0.7% | |
| 12 | 216 | 0.8% | 195 | 0.7% | |
| 13 | 205 | 0.8% | 182 | 0.7% | |
| 14 | 207 | 0.8% | 163 | 0.6% | |
| 15 | 163 | 0.6% | 173 | 0.6% | |
| 16 | 147 | 0.5% | 166 | 0.6% | |
| 17 | 183 | 0.7% | 143 | 0.5% | |
| 18 | 205 | 0.8% | 169 | 0.6% | |
| 19 | 270 | 1.0% | 270 | 1.0% | |
| 20 | 237 | 0.9% | 234 | 0.9% | |
| 21 | 216 | 0.8% | 220 | 0.8% | |
| 22 | 185 | 0.7% | 174 | 0.6% | |
| 23 | 158 | 0.6% | 135 | 0.5% | |
| 24 | 148 | 0.5% | 135 | 0.5% | |
| 25 | 146 | 0.5% | 133 | 0.5% | |
| 26 | 160 | 0.6% | 158 | 0.6% | |
| 27 | 174 | 0.6% | 192 | 0.7% | |
| 28 | 165 | 0.6% | 213 | 0.8% | |
| 29 | 198 | 0.7% | 194 | 0.7% | |
| 30 | 227 | 0.8% | 218 | 0.8% |
Policy Research Institute,
Source: Please email comments to: |
| 31 | 206 | 0.8% | 188 | 0.7% | |
| 32 | 224 | 0.8% | 248 | 0.9% | |
| 33 | 233 | 0.9% | 190 | 0.7% | |
| 34 | 216 | 0.8% | 219 | 0.8% | |
| 35 | 202 | 0.7% | 241 | 0.9% | |
| 36 | 228 | 0.8% | 190 | 0.7% | |
| 37 | 233 | 0.9% | 194 | 0.7% | |
| 38 | 196 | 0.7% | 186 | 0.7% | |
| 39 | 210 | 0.8% | 188 | 0.7% | |
| 40 | 200 | 0.7% | 175 | 0.6% | |
| 41 | 176 | 0.6% | 156 | 0.6% | |
| 42 | 159 | 0.6% | 197 | 0.7% | |
| 43 | 212 | 0.8% | 179 | 0.7% | |
| 44 | 138 | 0.5% | 134 | 0.5% | |
| 45 | 163 | 0.6% | 124 | 0.5% | |
| 46 | 138 | 0.5% | 151 | 0.6% | |
| 47 | 140 | 0.5% | 133 | 0.5% | |
| 48 | 117 | 0.4% | 126 | 0.5% | |
| 49 | 127 | 0.5% | 137 | 0.5% | |
| 50 | 112 | 0.4% | 131 | 0.5% | |
| 51 | 123 | 0.5% | 125 | 0.5% | |
(McPherson County, KS continued)
| AGE | Male | Female | |
||
| Number | Percent | Number | Percent | ||
| 52 | 108 | 0.4% | 125 | 0.5% | |
| 53 | 132 | 0.5% | 96 | 0.4% | |
| 54 | 117 | 0.4% | 125 | 0.5% | |
| 55 | 106 | 0.4% | 110 | 0.4% | |
| 56 | 97 | 0.4% | 131 | 0.5% | |
| 57 | 100 | 0.4% | 109 | 0.4% | |
| 58 | 111 | 0.4% | 131 | 0.5% | |
| 59 | 104 | 0.4% | 121 | 0.4% | |
| 60 | 120 | 0.4% | 127 | 0.5% | |
| 61 | 143 | 0.5% | 122 | 0.4% | |
| 62 | 106 | 0.4% | 136 | 0.5% | |
| 63 | 139 | 0.5% | 145 | 0.5% | |
| 64 | 123 | 0.5% | 135 | 0.5% | |
| 65 | 98 | 0.4% | 132 | 0.5% | |
| 66 | 109 | 0.4% | 125 | 0.5% | |
| 67 | 136 | 0.5% | 118 | 0.4% | |
| 68 | 80 | 0.3% | 126 | 0.5% | |
| 69 | 113 | 0.4% | 140 | 0.5% | |
| 70 | 85 | 0.3% | 130 | 0.5% | |
| 71 | 115 | 0.4% | 139 | 0.5% | |
| 72 | 96 | 0.4% | 121 | 0.4% | |
| 73 | 87 | 0.3% | 147 | 0.5% | |
| 74 | 84 | 0.3% | 136 | 0.5% | |
| 75 | 77 | 0.3% | 119 | 0.4% | |
| 76 | 86 | 0.3% | 148 | 0.5% | |
| 77 | 86 | 0.3% | 97 | 0.4% | |
| 78 | 74 | 0.3% | 114 | 0.4% | |
| 79 | 67 | 0.2% | 118 | 0.4% | |
| 80 | 62 | 0.2% | 107 | 0.4% | |
| 81 | 64 | 0.2% | 93 | 0.3% | |
| 82 | 55 | 0.2% | 89 | 0.3% |
Policy Research Institute,
Source: Please email comments to: |
| 83 | 41 | 0.2% | 104 | 0.4% | |
| 84 | 40 | 0.1% | 78 | 0.3% | |
| 85 | 40 | 0.1% | 77 | 0.3% | |
| 86 | 26 | 0.1% | 78 | 0.3% | |
| 87 | 27 | 0.1% | 66 | 0.2% | |
| 88 | 15 | 0.1% | 49 | 0.2% | |
| 89 | 19 | 0.1% | 52 | 0.2% | |
| 90 | 17 | 0.1% | 36 | 0.1% | |
| 91 | 8 | 0.0% | 47 | 0.2% | |
| 92 | 8 | 0.0% | 29 | 0.1% | |
| 93 | 6 | 0.0% | 27 | 0.1% | |
| 94 | 7 | 0.0% | 23 | 0.1% | |
| 95 | 7 | 0.0% | 10 | 0.0% | |
| 96 | 3 | 0.0% | 7 | 0.0% | |
| 97 | 1 | 0.0% | 8 | 0.0% | |
| 98 | 2 | 0.0% | 7 | 0.0% | |
| 99 | 2 | 0.0% | 0 | 0.0% | |
| 100 to 104 | 0 | 0.0% | 4 | 0.0% | |
| 105 to 109 | 1 | 0.0% | 0 | 0.0% | |
| 110 and over | 0 | 0.0% | 0 | 0.0% | |