McPherson County -- Estimated Population by Single Year of Age and Sex 2009
|
| AGE | Male | Female | 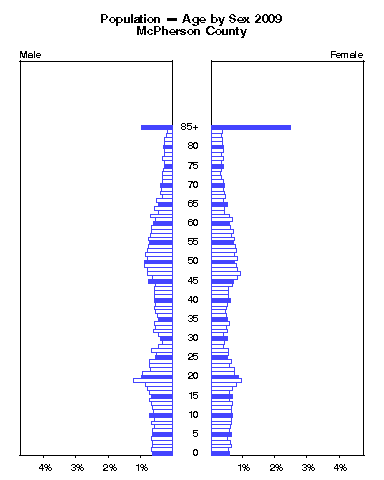 |
| | Number | Percent | Number | Percent |
| under 1
| 181 | 0.6% |
171 | 0.6% |
| 1
| 190 | 0.7% |
157 | 0.5% |
| 2
| 178 | 0.6% |
180 | 0.6% |
| 3
| 181 | 0.6% |
173 | 0.6% |
| 4
| 187 | 0.6% |
149 | 0.5% |
| 5
| 183 | 0.6% |
185 | 0.6% |
| 6
| 178 | 0.6% |
168 | 0.6% |
| 7
| 162 | 0.6% |
175 | 0.6% |
| 8
| 186 | 0.6% |
183 | 0.6% |
| 9
| 166 | 0.6% |
180 | 0.6% |
| 10
| 209 | 0.7% |
192 | 0.7% |
| 11
| 174 | 0.6% |
184 | 0.6% |
| 12
| 180 | 0.6% |
182 | 0.6% |
| 13
| 190 | 0.7% |
194 | 0.7% |
| 14
| 213 | 0.7% |
166 | 0.6% |
| 15
| 191 | 0.7% |
196 | 0.7% |
| 16
| 211 | 0.7% |
171 | 0.6% |
| 17
| 230 | 0.8% |
194 | 0.7% |
| 18
| 242 | 0.8% |
231 | 0.8% |
| 19
| 348 | 1.2% |
277 | 1.0% |
| 20
| 284 | 1.0% |
248 | 0.9% |
| 21
| 273 | 0.9% |
207 | 0.7% |
Click the figure above to animate by year. |
| 22
| 200 | 0.7% |
216 | 0.7% |
| 23
| 212 | 0.7% |
171 | 0.6% |
| 24
| 205 | 0.7% |
181 | 0.6% |
Institute for Policy & Social Research
.
https://ipsr.ku.edu/
The University of Kansas
Source:
Data used in this report are from the National Center for Health Statistics.
http://www.cdc.gov/nchs/nvss/bridged_race.htm
These estimates were prepared by the Population Estimates Program of the U.S. Census Bureau
under a collaborative agreement with NCHS. Released July 23, 2010.
Please email comments to:ipsr@ku.edu
These data, plus 2000-2008, are also available in Excel at:
https://ipsr.ku.edu/ksdata/census/estpop/sya09/sya20113.xls
|
| 25
| 153 | 0.5% |
150 | 0.5% |
| 26
| 145 | 0.5% |
155 | 0.5% |
| 27
| 188 | 0.7% |
152 | 0.5% |
| 28
| 126 | 0.4% |
114 | 0.4% |
| 29
| 93 | 0.3% |
127 | 0.4% |
| 30
| 112 | 0.4% |
146 | 0.5% |
| 31
| 130 | 0.5% |
117 | 0.4% |
| 32
| 169 | 0.6% |
149 | 0.5% |
| 33
| 153 | 0.5% |
137 | 0.5% |
| 34
| 168 | 0.6% |
170 | 0.6% |
| 35
| 128 | 0.4% |
149 | 0.5% |
| 36
| 136 | 0.5% |
138 | 0.5% |
| 37
| 153 | 0.5% |
134 | 0.5% |
| 38
| 162 | 0.6% |
142 | 0.5% |
| 39
| 153 | 0.5% |
146 | 0.5% |
| 40
| 159 | 0.6% |
175 | 0.6% |
| 41
| 162 | 0.6% |
155 | 0.5% |
| 42
| 167 | 0.6% |
155 | 0.5% |
| 43
| 159 | 0.6% |
158 | 0.5% |