Leavenworth County -- Estimated Population by Single Year of Age and Sex 2009
|
| AGE | Male | Female | 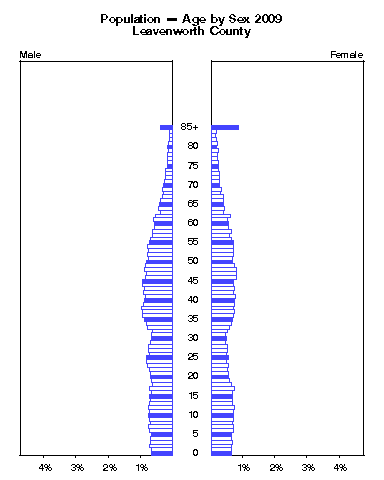 |
| | Number | Percent | Number | Percent |
| under 1
| 509 | 0.7% |
486 | 0.6% |
| 1
| 487 | 0.6% |
484 | 0.6% |
| 2
| 530 | 0.7% |
473 | 0.6% |
| 3
| 525 | 0.7% |
508 | 0.7% |
| 4
| 516 | 0.7% |
489 | 0.7% |
| 5
| 505 | 0.7% |
467 | 0.6% |
| 6
| 536 | 0.7% |
538 | 0.7% |
| 7
| 557 | 0.7% |
538 | 0.7% |
| 8
| 520 | 0.7% |
501 | 0.7% |
| 9
| 550 | 0.7% |
526 | 0.7% |
| 10
| 560 | 0.7% |
528 | 0.7% |
| 11
| 556 | 0.7% |
535 | 0.7% |
| 12
| 574 | 0.8% |
560 | 0.7% |
| 13
| 546 | 0.7% |
508 | 0.7% |
| 14
| 522 | 0.7% |
512 | 0.7% |
| 15
| 536 | 0.7% |
496 | 0.7% |
| 16
| 504 | 0.7% |
516 | 0.7% |
| 17
| 543 | 0.7% |
543 | 0.7% |
| 18
| 484 | 0.6% |
474 | 0.6% |
| 19
| 486 | 0.6% |
425 | 0.6% |
| 20
| 513 | 0.7% |
421 | 0.6% |
| 21
| 527 | 0.7% |
410 | 0.5% |
Click the figure above to animate by year. |
| 22
| 554 | 0.7% |
385 | 0.5% |
| 23
| 599 | 0.8% |
419 | 0.6% |
| 24
| 627 | 0.8% |
360 | 0.5% |
Institute for Policy & Social Research
.
https://ipsr.ku.edu/
The University of Kansas
Source:
Data used in this report are from the National Center for Health Statistics.
http://www.cdc.gov/nchs/nvss/bridged_race.htm
These estimates were prepared by the Population Estimates Program of the U.S. Census Bureau
under a collaborative agreement with NCHS. Released July 23, 2010.
Please email comments to:ipsr@ku.edu
These data, plus 2000-2008, are also available in Excel at:
https://ipsr.ku.edu/ksdata/census/estpop/sya09/sya20103.xls
|
| 25
| 601 | 0.8% |
411 | 0.5% |
| 26
| 535 | 0.7% |
369 | 0.5% |
| 27
| 574 | 0.8% |
386 | 0.5% |
| 28
| 559 | 0.7% |
385 | 0.5% |
| 29
| 529 | 0.7% |
346 | 0.5% |
| 30
| 490 | 0.7% |
360 | 0.5% |
| 31
| 511 | 0.7% |
343 | 0.5% |
| 32
| 480 | 0.6% |
377 | 0.5% |
| 33
| 576 | 0.8% |
440 | 0.6% |
| 34
| 627 | 0.8% |
478 | 0.6% |
| 35
| 651 | 0.9% |
507 | 0.7% |
| 36
| 713 | 0.9% |
532 | 0.7% |
| 37
| 702 | 0.9% |
546 | 0.7% |
| 38
| 733 | 1.0% |
537 | 0.7% |
| 39
| 673 | 0.9% |
547 | 0.7% |
| 40
| 658 | 0.9% |
551 | 0.7% |
| 41
| 641 | 0.9% |
572 | 0.8% |
| 42
| 689 | 0.9% |
534 | 0.7% |
| 43
| 672 | 0.9% |
553 | 0.7% |