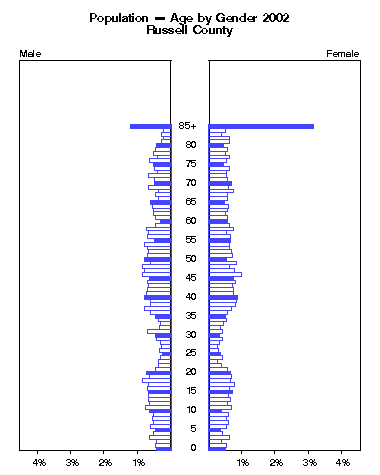
Russell County -- Estimated Population by Single Year of Age and Gender 2002
AGEMaleFemaleClick to animate.
 NumberPercentNumberPercent
under 1 30 0.4% 36 0.5%
  1 32 0.5% 38 0.5%
  2 31 0.4% 27 0.4%
  3 46 0.7% 43 0.6%
  4 37 0.5% 30 0.4%
  5 32 0.5% 25 0.4%
  6 43 0.6% 37 0.5%
  7 36 0.5% 42 0.6%
  8 39 0.6% 38 0.5%
  9 36 0.5% 42 0.6%
10 46 0.7% 28 0.4%
11 54 0.8% 49 0.7%
12 46 0.7% 39 0.6%
13 47 0.7% 47 0.7%
14 48 0.7% 42 0.6%
15 47 0.7% 50 0.7%
16 50 0.7% 44 0.6%
17 47 0.7% 55 0.8%
18 60 0.9% 47 0.7%
19 46 0.7% 49 0.7%
20 51 0.7% 46 0.7%
Click the figure above to animate by years.
21 32 0.5% 40 0.6%

Policy Research Institute    (http://www.ku.edu/pri)
The University of Kansas

Data Sources:
1990-1999 series - U.S. Census Bureau,
Annual Time Series of County Population Estimates.
http://www.census.gov/population/estimates/county/cas/cas20.txt

2000-2002 series - National Center for Health Statistics,
U.S. Census Populations With Bridged Race Categories
ftp://ftp.cdc.gov/pub/Health_Statistics/NCHS/datasets/nvss/bridgepop/pcenv2002.zip
NOTE: While there are revised data available for 1990-1999 for 5 year age groups,
revised single year of age estimates do not appear to be available.
The data for the animated pyramid from 1990 to 1999 are based on the estimates computed before the 2000 decennial census.


Please email comments to: pri@ku.edu
22 25 0.4% 28 0.4%
23 27 0.4% 19 0.3%
24 23 0.3% 30 0.4%
25 18 0.3% 25 0.4%
26 24 0.3% 20 0.3%
27 20 0.3% 18 0.3%
28 21 0.3% 22 0.3%
29 31 0.4% 30 0.4%
30 32 0.5% 24 0.3%
31 50 0.7% 29 0.4%
32 24 0.3% 25 0.4%
33 22 0.3% 32 0.5%
34 25 0.4% 38 0.5%
35 32 0.5% 36 0.5%
36 43 0.6% 39 0.6%
37 55 0.8% 48 0.7%
38 43 0.6% 56 0.8%
39 42 0.6% 58 0.8%
40 57 0.8% 61 0.9%
41 51 0.7% 53 0.8%
42 50 0.7% 52 0.7%
43 47 0.7% 51 0.7%

(Russell County continued)

AGEMaleFemale Click to animate.
 NumberPercentNumberPercent
44 50 0.7% 57 0.8%
45 45 0.6% 52 0.7%
46 60 0.9% 69 1.0%
47 55 0.8% 54 0.8%
48 61 0.9% 45 0.6%
49 42 0.6% 58 0.8%
50 56 0.8% 38 0.5%
51 50 0.7% 50 0.7%
52 48 0.7% 49 0.7%
53 49 0.7% 44 0.6%
54 56 0.8% 44 0.6%
55 35 0.5% 47 0.7%
56 49 0.7% 46 0.7%
57 47 0.7% 38 0.5%
58 51 0.7% 53 0.8%
59 32 0.5% 44 0.6%
60 21 0.3% 40 0.6%
61 33 0.5% 40 0.6%
62 36 0.5% 36 0.5%
63 36 0.5% 39 0.6%
64 38 0.5% 42 0.6%
Click the figure above to animate by years.
65 43 0.6% 34 0.5%

Policy Research Institute    (http://www.ku.edu/pri)
The University of Kansas

Data Sources:
1990-1999 series - U.S. Census Bureau,
Annual Time Series of County Population Estimates.
http://www.census.gov/population/estimates/county/cas/cas20.txt

2000-2002 series - National Center for Health Statistics,
U.S. Census Populations With Bridged Race Categories
ftp://ftp.cdc.gov/pub/Health_Statistics/NCHS/datasets/nvss/bridgepop/pcenv2002.zip
NOTE: While there are revised data available for 1990-1999 for 5 year age groups,
revised single year of age estimates do not appear to be available.
The data for the animated pyramid from 1990 to 1999 are based on the estimates computed before the 2000 decennial census.


Please email comments to: pri@ku.edu
66 25 0.4% 41 0.6%
67 33 0.5% 41 0.6%
68 27 0.4% 52 0.7%
69 47 0.7% 42 0.6%
70 34 0.5% 48 0.7%
71 35 0.5% 39 0.6%
72 47 0.7% 38 0.5%
73 29 0.4% 38 0.5%
74 34 0.5% 45 0.6%
75 36 0.5% 32 0.5%
76 45 0.6% 37 0.5%
77 28 0.4% 44 0.6%
78 37 0.5% 36 0.5%
79 33 0.5% 41 0.6%
80 30 0.4% 32 0.5%
81 19 0.3% 45 0.6%
82 15 0.2% 45 0.6%
83 20 0.3% 28 0.4%
84 16 0.2% 35 0.5%
85 and over 85 1.2% 223 3.2%