[an error occurred while processing this directive]
GIS at IPSR
IPSR is a respository for Kansas data and a hub of interdisciplinary
policy research. As such, GIS plays a critical role in IPSR's research
and data services. IPSR's primary use of GIS incorporates the U.S.
Census Bureau's TIGER® data with Census and other demographic
and socio-economic data on the State of Kansas.
For more information on GIS education, news, and research at KU, please
check out GIS@KU at http://gis.ku.edu/.
Papers/Presentations
Step-by-Step Guide to Geocoding Using U.S. Census TIGER
[Updated for TIGER 2009 and ArcMap 9+]
Thematic Mapping with Google Maps (PPT, May 2010)
The Geography of Census (PPT, October 2014)
Web Maps with Leaflet (PPT, November 2014)
SAS Bridge for ESRI Instructions (PDF, October 2015)
General Guide to Geocoding using ArcGIS at the University of Kansas (PDF, July 2017)
Animated Maps
Please visit http://ipsr.unit.ku.edu/ksdata/GIS/anim/ for a list of animated maps.
Map Applications
Kansas Data Archive Portal
http://ipsr.unit.ku.edu/ksdata/ksah/portal.shtml
Interactive map application written in PHP to read MySQL database and write JavaScript to utilize Google Maps API.
Kansas City Metro Data Explorer
http://ipsr.unit.ku.edu/ksdata/apps/KCMOtracts.php
Interactive map application serving up the core elements of the U.S. Census Bureau's American Community Survey for Census Tracts in the KC Metro area. This application is written in PHP, reads data from MySQL, and utilizes Leaflet for mapping.
Lawrence (Kansas) Bike Accidents
http://ipsr.unit.ku.edu/ksdata/apps/bike/map.php
Interactive map displaying vehicle-bicycle accidents in Lawrence, Kansas from April 2008 - March 2013. Users can toggle on/off layers for shared-use paths, bike lanes, and bike routes as well as query the data for a number of conditions.
From the Ground Up
http://ipsr.unit.ku.edu/groundsite/
Now archived site that featured a variety of landscape art/artists in eastern Kansas. Developed in 2006 this interactive map allowed users to explore the place in which art was created.
Sample Maps
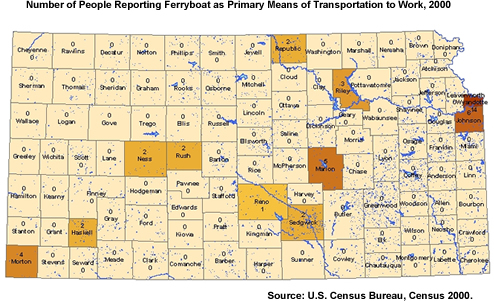
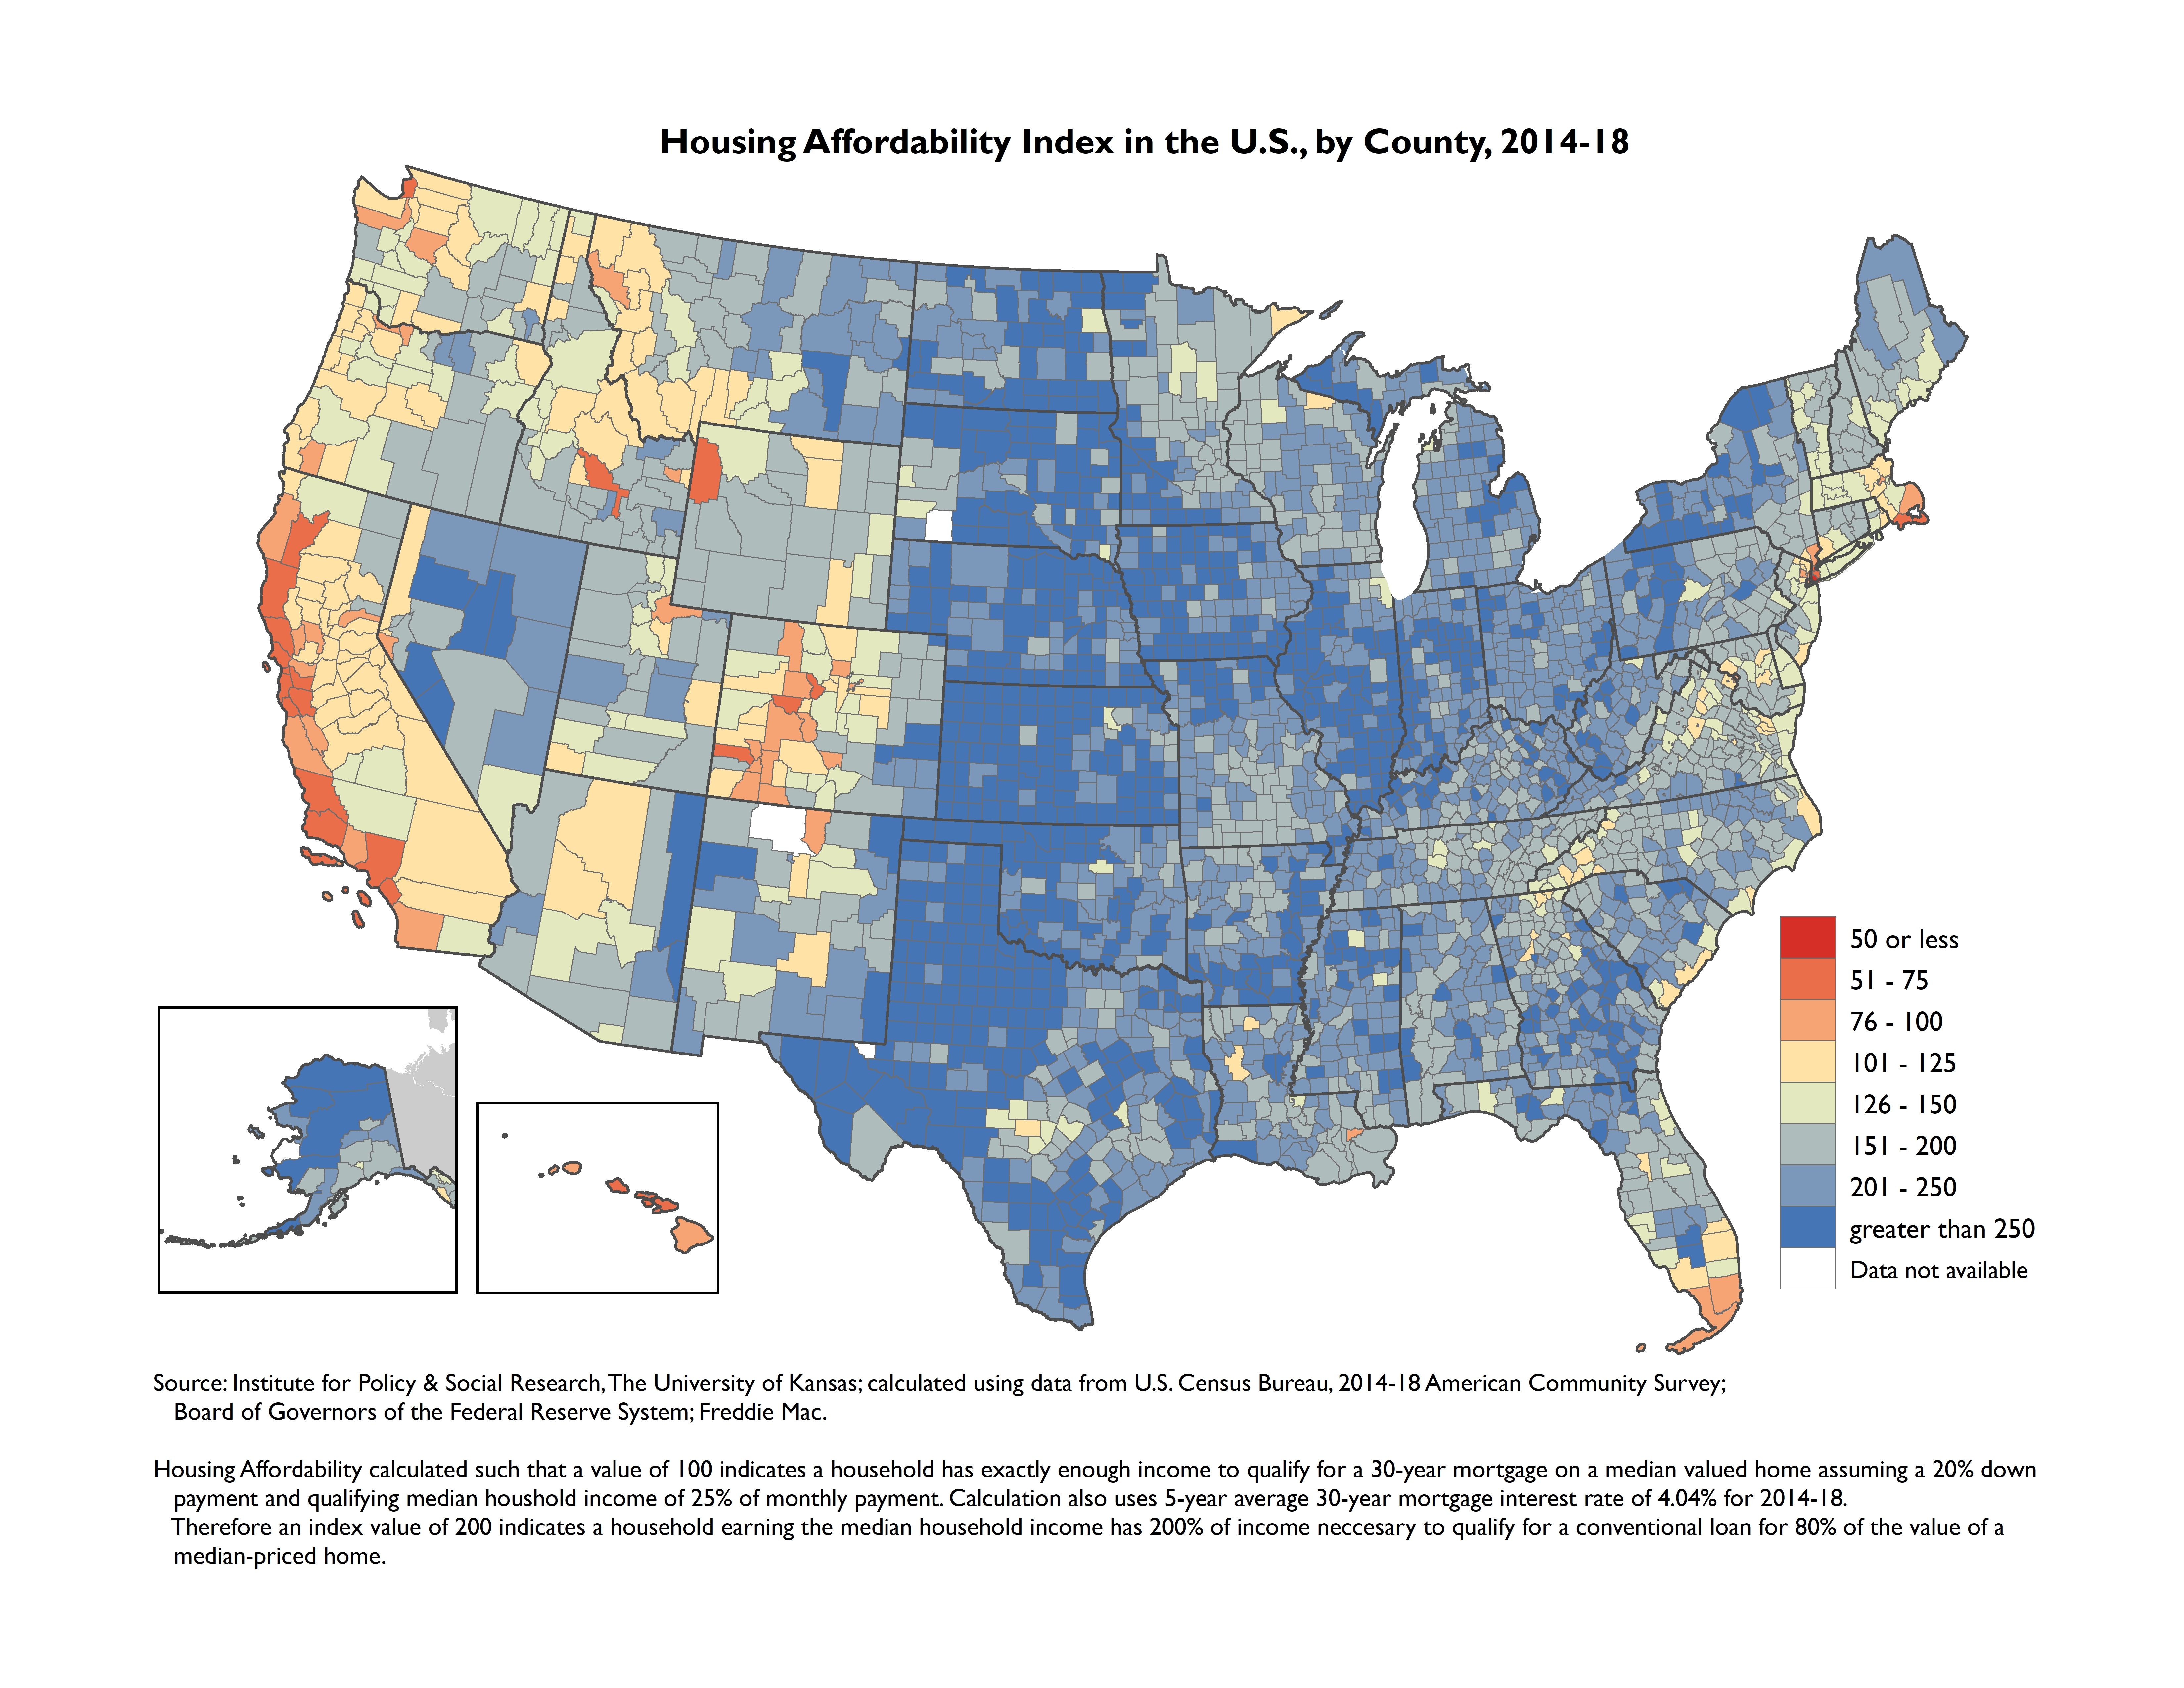
Cartogram Animation of Decennial Population by Kansas County, 1900-2000 [requires FLASH Plug-in]


For more information on TIGER® or mapping Census data, please
contact:
Xan Wedel
Institute for Policy & Social Research
The University of Kansas
1541 Lilac Lane, Suite 607
Lawrence, KS 66045-3129
email: xan@ku.edu
[an error occurred while processing this directive] 
