
PreAward Visualization Resources
Why?
 | Funding agencies increasingly require or request graphics in proposals. Commonly, logic models, gantt plots or timelines are required components of an application. Some grant programs request concept graphics that illustrate relationships between project components and key ideas. |
Toolkit
The toolkit is a single PowerPoint file containing information and templates for timelines, Venn diagrams, and concept models along with a single Excel file and a Word file containing additional timeline templates.
- Toolkit (PPT)
- Excel file with additional timeline templates
- Word file with additional timeline templates
How to Use
The templates above are meant to be a starting point. As with research, creating a good visualization is an iterative process. If you find a template you like, you can add text or change colors to fit your proposal. To capture an image:
- Windows: Press Ctrl-Alt-PrtScn (Control, Alt, and Print Screen). The image is now on the clipboard. Press Ctrl-V to paste it into your proposal.
- Mac: Press Shift-Command-3. The screenshot is now a .png file on your desktop.
Insert, or paste, your visualization into your proposal then crop as needed.
Examples
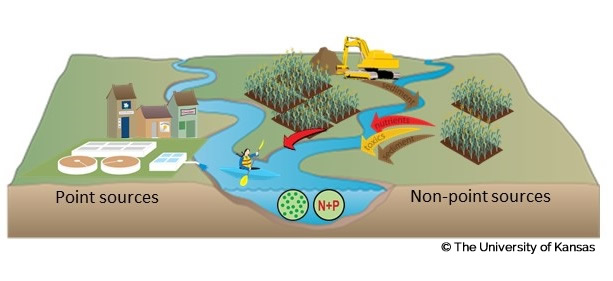
The Charge: (NSF-CNH Program-Pending). This section must clearly specify the major components of the project (1) the dynamics within one or more natural systems; (2) the dynamics within one or more human systems; (3) the processes through which the natural systems affect the human systems; and (4) the processes through which the human systems affect the natural systems. A diagram illustrating these components and their integration is not required but is strongly encouraged.
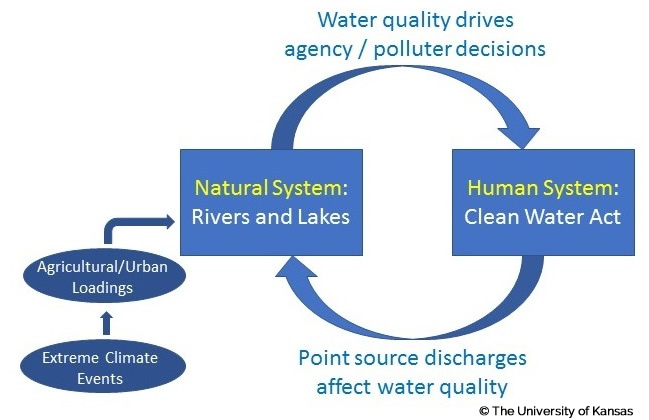
Caption/Context: The human system couples to the natural system as regulated facilities’ discharges clearly undermine ambient surface water quality. This impact sets in motion dynamic relationships within the human system. TMDL establishment may affect subsequent (1) permit writers’ imposition of discharge limits, (2) agencies’ inspection decisions, (3) agencies’ enforcement decisions, and (4) polluters’ discharge decisions. Similarly, discharge limit imposition might influence subsequent (1) agencies’ inspection decisions, (2) agencies’ enforcement decisions, (3) and polluters’ discharge decisions. Moreover, agencies’ inspection and enforcement decisions should impact subsequent polluters’ discharge decisions.
The Charge: NSF CAREER Program (Awarded). This program embodies NSF’s commitment to encourage faculty and academic institutions to value and support the integration of research and education. Successful Principal Investigators will propose creative, effective research and education plans, developed within the context of the mission, goals, and resources of their organizations, while building a firm foundation for a lifetime of contributions to research, education, and their integration.
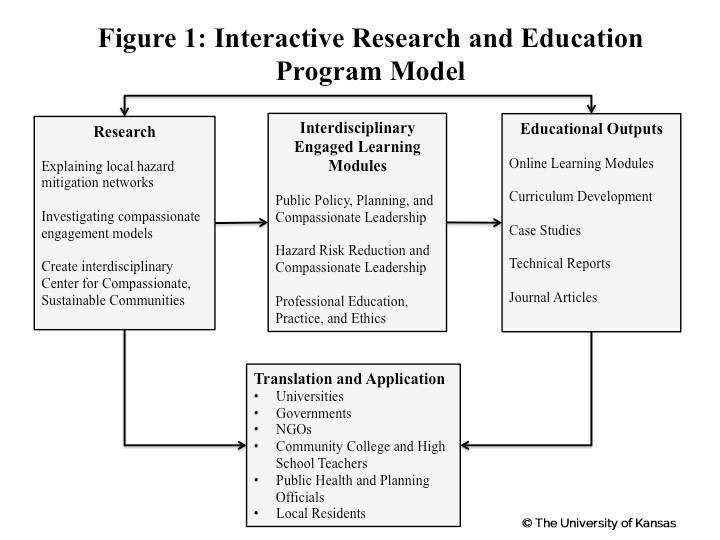
Caption/Context: [Program] objectives will be achieved by implementing the interactive research and education model shown in Figure 1. The research component centers on investigating local mitigation networks and compassionate engagement models. The interdisciplinary engaged learning modules (IELMs) will complement the research program and feed into a diversified set of education outcomes. The educational outcomes will feed back into the research program and, together, the research program core and education outputs will inform the translation and application component.
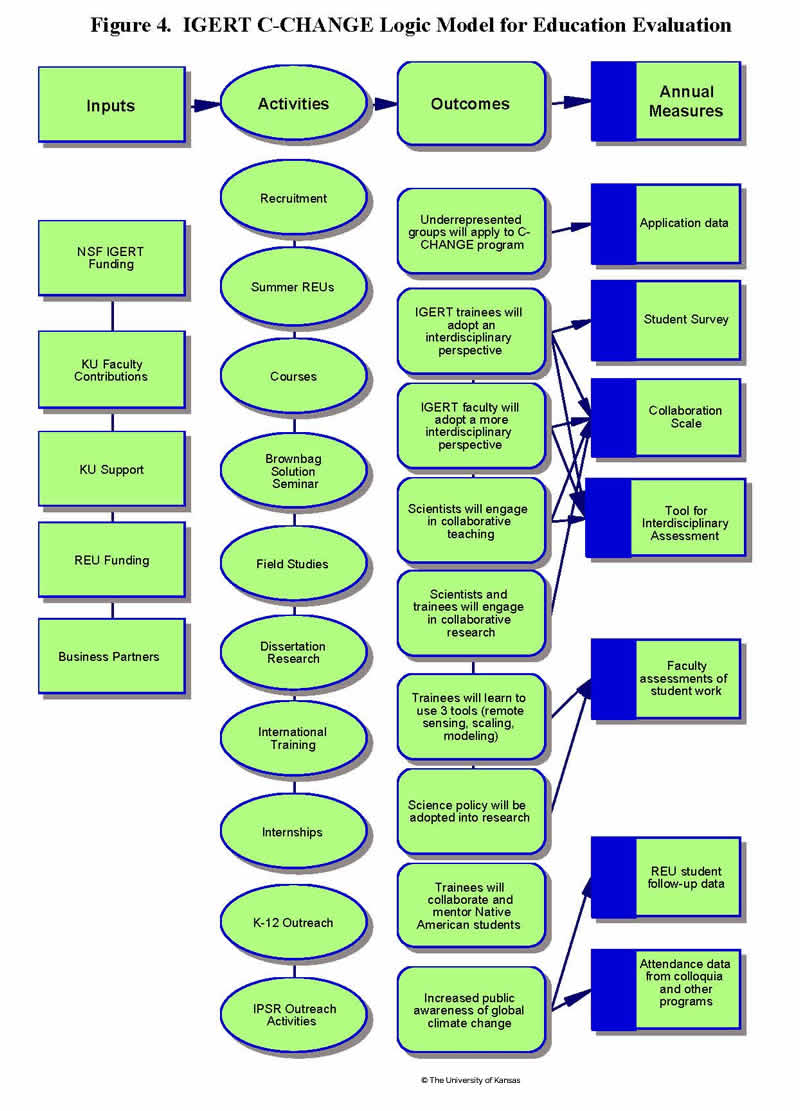
The Charge: (NSF-IGERT-Awarded). Describe the plan to measure qualitatively and quantitatively the success of the project in achieving its goals, particularly the degree to which student perspectives on science, engineering, or education research related to these disciplines have been expanded. Proposers may wish to consult The 2002 User-Friendly Handbook for Project Evaluation for guidance on the elements in a good evaluation plan (which include a logic model).
The Charge: In Project Description, provide a brief description of the objectives of the proposed site, targeted student participants, intellectual focus, organizational structure, timetable, and participating organizations' commitment to the activity.
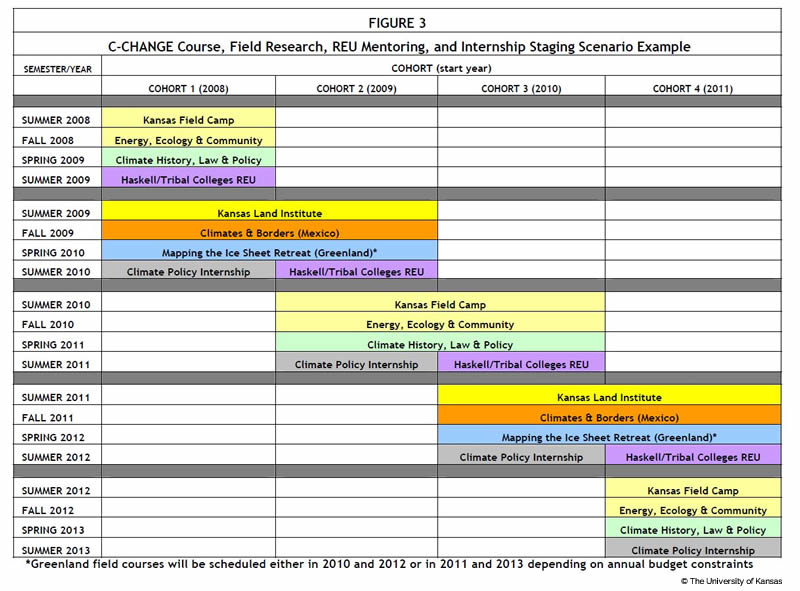
Caption/Context: Figure 3 presents an example of the staging of courses, research activities, science policy internship, and Haskell/Tribal REU research and mentoring program for each cohort of CCHANGE trainees. Trainees enroll in one course, field research activity, REU collaboration, or internship in each of four semesters and two summers; the Greenland field course will be offered in 2010 and 2012 or in 2011 and 2013 depending on NSF annual budget constraints.